Darkhorse Analytics helps U.S. project visualize public health data
An Edmonton analytics company has partnered with a Michigan university to produce a comparative visualized database to equip policymakers and service providers with actionable insights to improve public health.
Darkhorse Analytics built the Population Health Outcomes Information Exchange (PHOENIX) for a project based at Wayne State University. PHOENIX allows users to see the intersections of what we think of as standard health data (diagnosis, disability, dental visits) with information traditionally thought of as social (socioeconomic status, gun violence, education).
Although one might reasonably conclude that social disadvantage and disease have links, PHOENIX's purpose is to provide decision-makers and "interventionalists" with a lens to examine complex factors and find their correlations.
"The reality is that we don't know what causes the distribution and frequency of disease, and if we did, we'd be a lot better at preventing it," said epidemiologist Steven Korzeniewski, the lead researcher on the project. "We can talk about social vulnerability. We can talk about poverty. But the reality is, we don't know which aspects of social suffering are actually contributing to which types of diseases."
Korzeniewski reached out to Darkhorse after seeing its Opportunity Atlas, about 18 months ago. Opportunity Atlas is a project commissioned by Brown and Harvard universities. Using anonymized data from 20 million Americans that spanned their childhoods to mid-30s, it traced wealth and poverty levels back to the neighbourhoods where those surveyed grew up. It was a viral hit and just one example of Darkhorse's work examining complex social phenomena through visualized data.
Wayne State's needs were a good fit for Darkhorse's capabilities, vice-president Craig Hiltz told Taproot. "There's a lot of effort on the front end to get this kind of data put together," he said. "They came with the data."
Release 3 is online now, and Darkhorse is working on Release 4, with potentially more to come, Hiltz said. "It's an evolution, and that's how these data visualizations often work," he said.
Engaging Darkhorse was "probably the best decision I made professionally in the last few years," Korzeniewski said. "It was more of an interview than a request. They wanted to know about the social commitment, what the project was about, and whether it was something to get involved in. They would tell you what's not possible (and) what is possible, and they will give you a reasonable answer as to why you're in either camp. And that is very rare, from what I have found."
PHOENIX makes it possible to visualize a great deal of health information in the Great Lakes region of the United States. It's not quite so straightforward to do such a project in Canada, said Health Cities CEO Reg Joseph.
"We have ethics requests for data, and those ethics requests are very, very specific, in the sense that someone that's doing research will have to identify specifically what the hypothesis is," he said. "And then what they're predicting the data is going to do, and then you need to make a request for just that data."
That doesn't translate well to the kind of work Wayne State did, Joseph added. "To be really clear, it's the policies… not our technical capabilities or our analytics capabilities. We have that in spades."
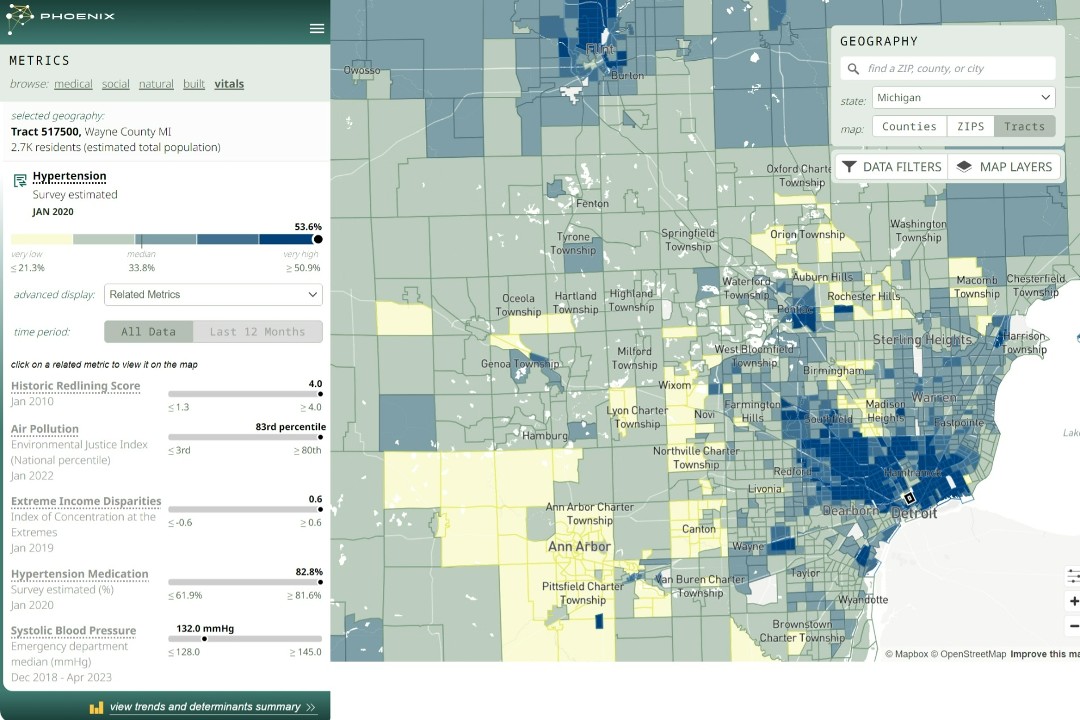
The PHOENIX health-data-visualization tool allows users to choose a metric, place, and time period, and then provides a summary of trends and determinants. (Wayne State University)
Joseph believes in data visualization. He says that it helps foster a connection between facts and understanding.
"I think a data visualization really enables us to start looking at variables that can impact any particular field of study, whether it's health or social services, or whatever," he said. "It is easier for us as humans to digest that information."
While we may not have an equivalent to PHOENIX in Alberta, Joseph and his team have been working on the Edmonton Community Data Warehouse, a collaboration with PolicyWise for Children & Families that aims to improve the delivery of social services.
"Right now, we're just at the stage of working with a group of social-serving agencies that have agreed on a path to move forward. We're just identifying what are some of those common data pieces that we could use together to drive better decision-making," Joseph said. "The bigger goal is (that) we could start linking our social intelligence and health data to really drive impact on mental health and addictions and health systems."
The Data Warehouse is currently moving into its second phase out of a total of three, Health Cities staff member Cassandra Rasko said.
"We are moving, as we say, proudly slow in this effort," she said. "The first bit of data that will be going into the Data Warehouse likely will be anonymized demographic data, just to prove that the model works, then we'll go from there."
Rasko said Phase 2 involves "infrastructure, sharing agreements, governance policies, (and) data sovereignty." This establishing work precedes the actual import of data planned for Phase 3.
Meanwhile, Korzeniewski is thinking about the future of PHOENIX.
"This is a never-ending project. This will be a life project, and it will grow in a lot of different ways," he said. "This is a public-facing, open-access tool, that everyone can use at no cost. If we do things that will be behind a login, or if there's ever going to be a paywall for anything… (that revenue will be used) to sustain the ability to give information out freely to the public."
Share