Is your neighbourhood vulnerable to climate change? New research provides answers
University of Alberta researchers have used public data to create a set of maps that illustrate the Edmonton neighbourhoods where residents are most vulnerable to negative health outcomes caused by climate change.
The team found that much of the city's south and west have more people who hail from vulnerable demographics, more exposure to pollution and extreme weather, and less natural protection. Added up, these factors make residents in these areas more vulnerable than others in the city.
"These maps aren't meant to stigmatize any particular areas — just because you might live in an area with higher vulnerability, we're not saying you need to move," said Sammy Lowe, the research lead of the university's Climate, Health, and Environment Epidemiology Research lab. The levels of vulnerability between the neighbourhoods are all relative to each other, he explained. "Edmonton, in general, is actually doing pretty well in the grand scheme of things in terms of climate health vulnerability. So even though some of these areas are a bit worse, they're not necessarily doing terribly."
The researchers determined that the city areas and residents least vulnerable to climate change are around the university, downtown, Oliver (soon to be wîhkwêntôwin), Bonnie Doon, North Glenora, Spruce Avenue, Beverly, and Mill Woods Town Centre.
The lab's goal is to guide governments to spend money strategically in areas where it will make the most difference and on projects that make the most sense for a neighbourhood.
When determining how vulnerable a neighbourhood is, the lab takes three domains into account: its risk of experiencing pollutants and extreme weather (exposure), its features that can mitigate those consequences of climate change (adaptability), and socioeconomic and demographic traits that can make its residents more susceptible (sensitivity). Those three factors combine to indicate a neighbourhood's vulnerability.
Taproot took a closer look at what specifically makes neighbourhoods more or less vulnerable and what can be done to help mitigate health problems from climate change.
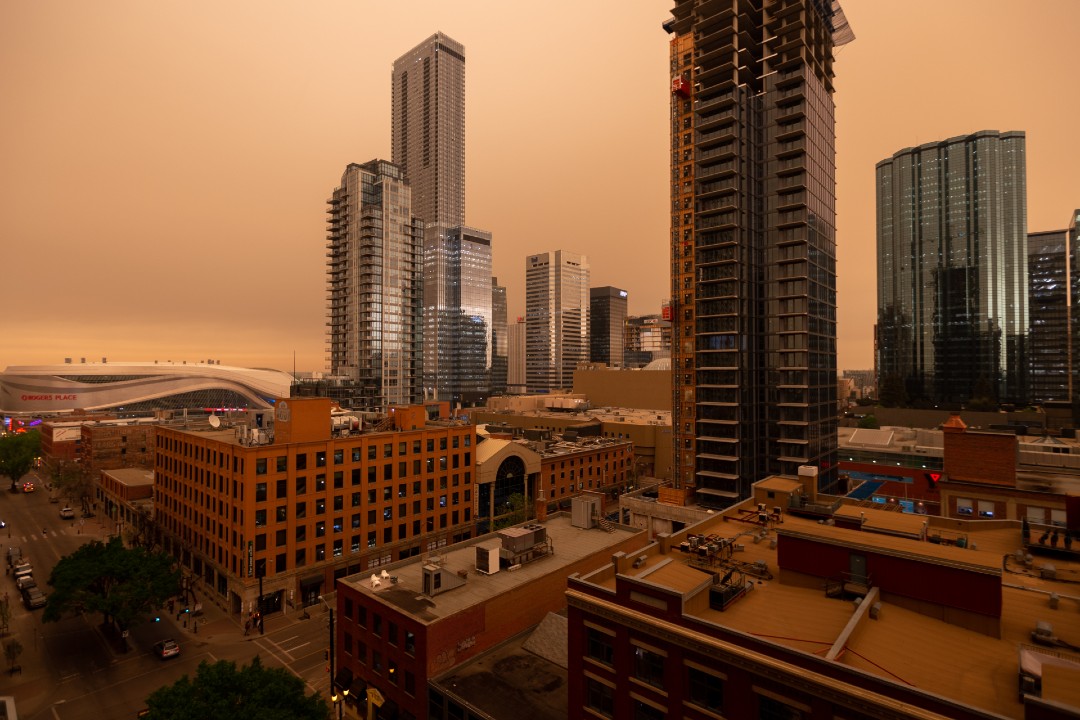
A University of Alberta research team has compiled publicly-available data that suggests downtown is one of the least vulnerable neighbourhoods when it comes to negative health outcomes from pollution and extreme weather. (Mack Male/Flickr)
Adaptability
Lowe said a major factor in adaptability is proximity to green space or water. Large bodies of water and dense trees can help mitigate extreme heat and, to some degree, air pollution. "In some of these areas in the southwest of the city, where it's farther away from (the river valley), maybe sparser green space, maybe more built-up roadways and asphalt, and things like that, they may be getting more exposure that way," he said.
The maps were created in partnership with the City of Edmonton, and Lowe said a separate group from city administration later reached out to the lab. The team expressed interest in how the maps could point to where it should focus tree planting efforts, as trees can increase a neighbourhood's adaptability.
"Addressing (climate change) is going to be this really interdisciplinary thing, so by getting these different partners involved and communicating and realizing maybe our efforts are going to be best served in this way instead of spreading us too thin across the entire city in the same way, we can really effectively mobilize our collective action toward addressing climate impacts," Lowe said.
Exposure
A neighbourhood's geographic location and built environment can leave it more or less exposed to pollution and extreme weather, Lowe said. Wind currents can blow wildfire smoke toward neighbourhoods, while tall buildings in the city's central areas can help lower a neighbourhood's exposure.
"Even though skyscrapers, we don't necessarily think of them as particularly environmentally beneficial, having these big structures can actually block some of those pollutants and some of that direct sunlight," he said.
Sensitivity
Many neighbourhoods on the map got a high sensitivity score, meaning a mix of factors makes the residents more sensitive to exposure. "We know that really young children or really older adults are perhaps more sensitive to environmental exposure. If an area has a lot of kids, for example, that area might be what we consider more sensitive," Lowe said.
Income also greatly affects sensitivity, as well as exposure and adaptability, according to the Canadian Climate Institute.
"Although an imperfect proxy, poverty is a driving factor behind all three dimensions of vulnerability," the institute said, in a report. "Those that can afford to prepare, move, rebuild, or recover are not as vulnerable as those that are poor." Poverty correlates with other factors that shape vulnerability, like education, health care, discrimination, clean drinking water, and inadequate access to water, the institute said.
What's next?
Lowe said the research team wants to add more information about the city's built environment to the map, like how much asphalt is in a neighbourhood. Asphalt can absorb up to 95% of the sun's energy, which is then radiated back into the air, exacerbating the urban heat island effect. Lowe said he also hopes to research which communities have cooling centres and places where people can get a break from wildfire smoke, or even just centrally-located community centres with air conditioning that are open to the public.
"We've been able to get some great insights based on the data we have, but there are these key pieces of the built environment that we know are playing a role, but the data just isn't out there," Lowe said.
The Centre for Disease Control outlines which health issues the more sensitive Edmontonians may be at risk of. Pollution can lead to asthma, cardiovascular disease, and more severe diseases. Extreme weather can result in mental stress, injuries, frostbite, and heat-related illness and death. The Canadian Association of Physicians for the Environment said climate change is "the biggest public health challenge of this century."
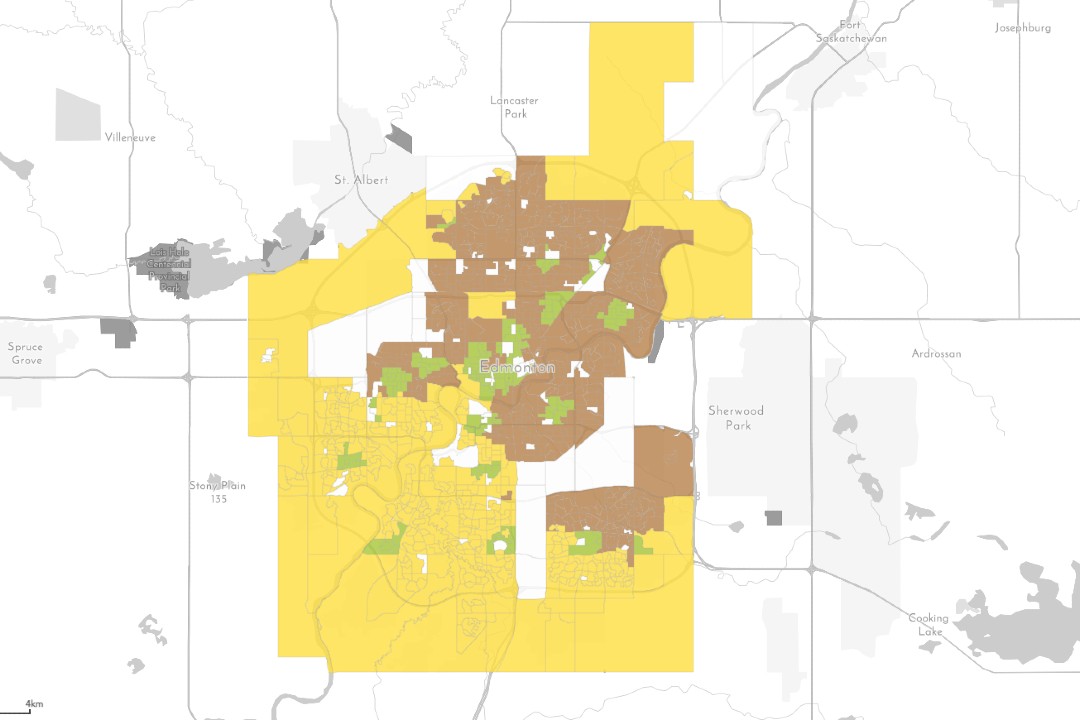
The research team found that the south and west areas of Edmonton are the most vulnerable to negative health outcomes from climate change. (University of Alberta)
Edmonton's population is booming. Statistics Canada data shows that it grew between 2016 and 2021 in many of the yellow areas and fell in some of the green areas. The west end of the city — west of 156 Street and south of Yellowhead Trail — grew by more than 10%. South of Anthony Henday Drive, the population grew by 32%. At the same time, the population in Edmonton's core fell by about 1%.
But Lowe said he isn't necessarily concerned that population is growing quickly in areas that need the most work in mitigating extreme weather and exposure to pollutants. "Maybe I'm naive, but I'm more like, 'Okay, this is actually a really good opportunity,'" he said. "If we're going to have a lot of people and a lot of vested interest in these areas, let's highlight the particular areas where we can improve."
The next steps for the map include expanding it to the whole province. The team also wants to educate people on how they can mitigate extreme weather. For example, on a hot or smokey day, a person could click on their neighbourhood and get a list of nearby cooling centres or a place to get a break from the smoke.
Share