Chart
Recent stories about chart

Podcast questions presentation of police data
The Edmonton Police Service raised the alarm about an increase in violent crime based on newly released data for 2022, but Episode 218 of Speaking Municipally had questions about those numbers.
Read the story

Data shows the ebb and flow of mosquito season
You've probably never swatted a mosquito and stopped to ask yourself if it was a Culex or an Ochlerotatus, but that is one of the considerations guiding Edmonton's ever evolving pest control program.
Read the story

On-demand transit seems to be catching on
An interim review of the bus network redesign shows growing use of on-demand transit since it was introduced last April to mitigate a decrease in regular service to parts of the city.
Read the story

More than 90K visits to Edmonton public washrooms recorded in 2021
Public washroom visits were up by 140% in 2021 compared to the previous year, according to an update from the City of Edmonton that will be going to committee next week.
Read the story

Announcement of optional passport system spurs uptick in COVID-19 vaccinations
Alberta's vaccine passport system didn't come into effect until Sept. 20, but the Edmonton health zone already experienced a spike in vaccinations the day after the program was announced, according to data from Alberta Health Services.
Read the story

A look back at how councillors voted as Edmonton prepares to usher in a new council
Edmonton city council held its final meeting last week before breaking for the upcoming municipal election. Edmonton's Open Data Catalogue provides a look back at how councillors voted over the past four years, which sheds some light on council's direction and the structure of its voting process.
Read the story

Chart of the week: A look at Edmonton's dry decade
It's the end of a very dry summer in Edmonton, and while 2021 was particularly parched, it's the latest of a decade-long trend that has seen less rainfall in the city, according to data from Environment Canada.
Read the story

Edmonton hotels face slow but steady recovery
Visitors are booking more hotel rooms in Edmonton this year, but the industry has a long way to go to get back to pre-pandemic levels, according to data from the Alberta government.
Read the story

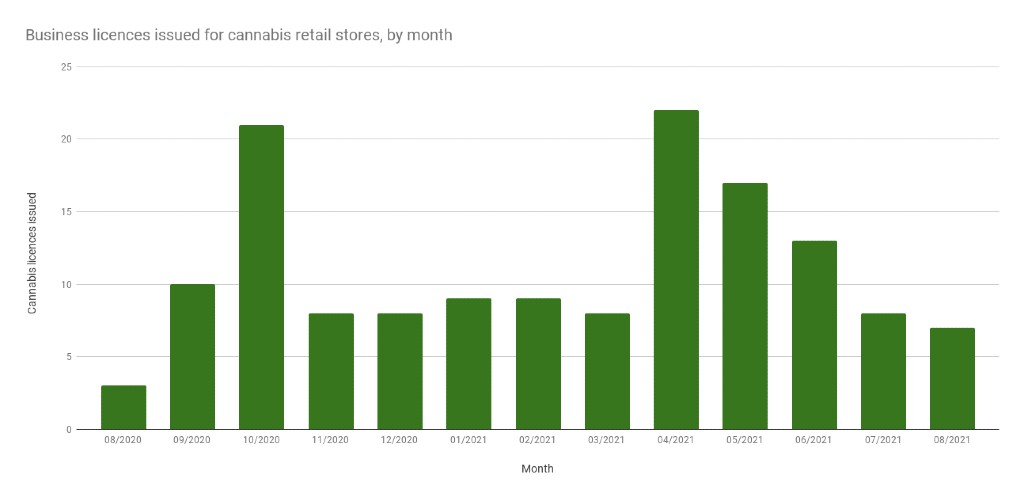
Chart of the week: Cannabis licences
The number of retail cannabis licences issued in Edmonton has been dropping since April, but a 90% cut to licensing fees may help reverse that trend in the new year.
Read the story
